Executive Summary
- The Philippines has not been spending enough on education and has not been spending well what little it has. This is consistent with research evidence showing how much resources there are and how they are used matter in improving learning outcomes.
- Education governance is characterized by a high concentration of resources at the national level, unmaximized local resources, and low levels of autonomy at the local level.
- A fiscal decentralization model of Philippine basic education governance that aims to ensure adequacy, equity, efficiency, and performance of education services is recommended.
Meager resources for basic education that unsurprisingly explains poor learning outcomes.
- According to the OECD, the cumulative expenditure per student, over ten years of age between 6 and 15, in the Philippines was equivalent to about USD 11 000 (PPP). This is significantly below the USD 75 600(PPP)-threshold, wherein economies saw a variation of 27% in their math scores explained by increased education spending.
- Post PISA 2018, the government has increased the share of education, culture, and sports development in the national budget: from 15.76% in 2020 to 17.05% in 2024.
- Albert, Basillote, and Muñoz (2021) calculated that the government needs to quadruple its spending in education to reach the global reading proficiency standard.
- Learning poverty, defined as the inability to read and understand a simple text by age 10, is still at 90% in the Philippines (World Bank). PISA 2022 results show that while there were some improvements in the raw scores in reading (+7) and math (+2), and a one-point decline in science, these were not statistically significant. Less than a quarter of students scored below the minimum global competency in reading (24%), math (16%), and science (23%).
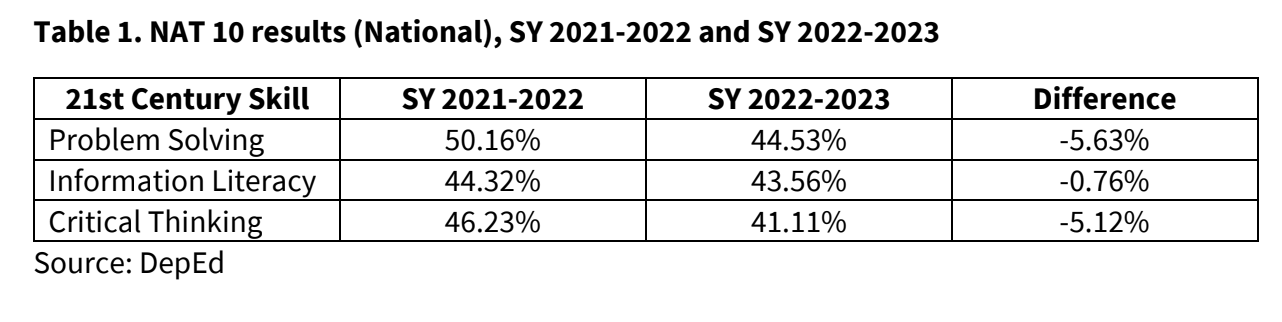
- National Achievement Test scores corroborate those of international large-scale student assessments. At least half of Grade 10 students in SY 2021-2022 achieved low proficiency (<50%) in problem solving (50.16%), information literacy (44.32%), and critical thinking (46.23%). This got worse in SY 2022-2023 (see Table 1), wherein more Grade 10 students scored low proficiency in the three 21st Century Skills tested.
Fiscal governance of Philippine education is highly concentrated, with signs of inequity, inefficiency, and low levels of local autonomy.
- The basic education budget (DepEd) can be broken down into allocations for personnel services (salaries), maintenance and other operating expenditure (MOOE), and capital outlay. It is worthwhile to note that overall budget efficiency, defined in obligation and disbursement rates, has been >90% from 2016-2020. As salaries historically account for 80% of the spending of the Department of Education, analysis of the budget’s adequacy, efficiency, and equity will mainly refer to the MOOE and capital outlay budgets.
- Expenditures for salaries are almost all made from the national government. The DepEd Central directly disburses salaries of its personnel, with Division Offices nominally signing off on the payroll. Paying teachers nationally and giving them contracts protected by civil service rules, to a certain extent, isolates them from politicking, as they will not have to fear for their salaries being held hostage nor their employment threatened.
- The DPWH oversees school construction under the DepEd-DPWH MOA, the funds for which are turned over from DepEd to DPWH. The list of schools for classroom construction is reported by Divisions Offices and compiled by the DepEd Central through a local school inventory database. Construction is centrally prioritized through a criteria (i.e. makeshift classrooms, shifting of classes etc.) and budgeted (as proposed in the GAA) but funds go to DPWH District Engineering Offices for procurement and implementation. Local governments may build classrooms using their Special Education Funds. Classroom repairs are handled by DepEd Division Offices.
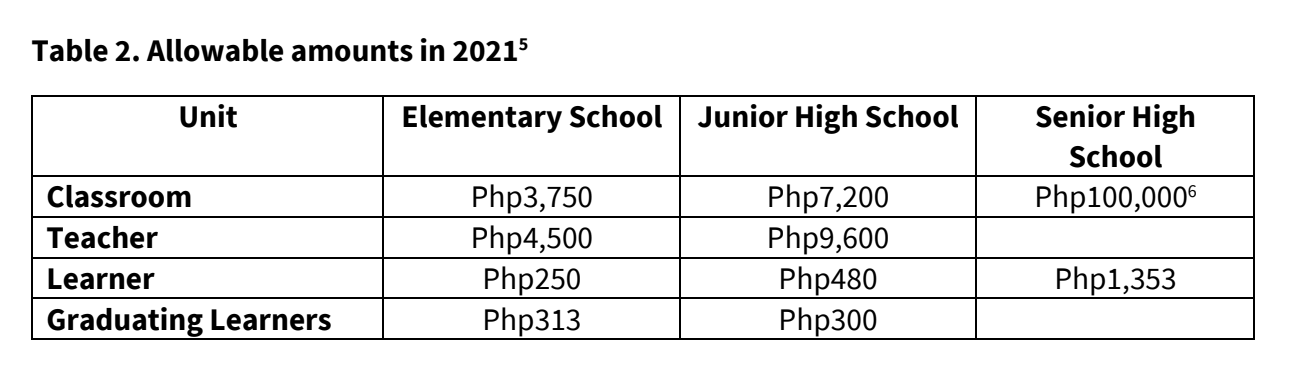
- There is relatively high efficiency in the use of the MOOE. For example, 91% of the 2022 MOOE was obligated. The MOOE is calculated using the Boncodin formula:
- School’s MOOE = Fixed amount + (allowable amount x Number of Classrooms) + (allowable amount x Number of Teachers) + (allowable amount x Number of Learners) + (Allowable amount x Number of Graduating Learners)
- Where the fixed amount in 2021 for an elementary school is Php50,000, or Php96,000 for a junior high school, or Php100,000 for a stand-alone senior high school. The variable/allowable amounts (2021) are shown in Table 2 below.
- Interviewees, especially those from schools in remote/rural areas, shared that their MOOE is not enough due to higher electricity rates, high cost of transportation, and lower enrollment numbers in rural schools due to rural-urban migration. While the MOOE formula is sensitive to differences in enrollment, it is not as sensitive to the marginal decrease in the costs of operating a school. In other words, the cost of operating a school doesn’t vary as much per capita, but the MOOE allocation does. This is the case for example when it comes to the cost of internet connection where the subscription unit is per school, and not per capita.
- There is no budgetary distinction and allocation made for the school’s location (e.g., distance from center/rural-urban) and socio-demographic composition (e.g., socio-economic status).
- In interviews of DepEd personnel (schools division superintendents, district supervisor, and school heads), the Boncodin formula gives an impression of equity and fairness in the MOOE allocation. However, realities on the ground tell a different story. A school head of rural school in Mindanao reported higher costs of running her school due to higher electricity rates and the transportation support needed by her students and teachers. A school head of an urban school in the Visayas reported higher costs associated with meeting high incidence of mental health issues in her school.
- The capital outlay budget has more than doubled from the programmed Php20,570,243,000 in 2022 to Php48,810,115,000 in 2024. However, actual capital outlay in 2022 was only Php7,290,668,000, equivalent to a 35% disbursement rate in that year. This could partly explain the shortage of 159,000 classrooms in 2023. Interviewed local chief executives and school heads have also cited land titling and lack of buildable space as reasons for the low utilization of capital outlay funds.
- A number of regular program funds managed from the Central Office. One former high-ranking DepEd official opined that many of these regular program funds, like Support for Mental Health Program, Campus Journalism Program, Early Language Literacy, and Indigenous Peoples’ Education Program, can be better managed at the division and even at the school level. There is also the tendency of late intergovernmental transfers of these program funds from the Central Office to Schools Divisions and schools, putting pressure on local education officials to expend the funds before they expire. One schools division superintendent (SDS) from the Visayas said that while well-equipped and capacitated divisions might be able to “rise to the challenge,” this might not be the case for many divisions. Unexpended funds could have a negative impact on the performance-based bonus of DepEd officials.
- The education budget in the Philippines has two public sources: national and local. Between 2010 and 2019, 95% of basic education spending was made by the national government while local governments accounted for 5% of public basic education spending. This demonstrates the highly concentrated nature of education spending in the Philippines.
- The Local Government Code of 1991 mandates local governments to allocate 1% of their real property tax collection on a Special Education Fund (SEF). The SEF is managed by a local school board composed of the local chief executive, a DepEd representative, member of the parents teachers association, and civil society.
- The sentiment on the ground is that local governments and local school boards merely play a complementary role to DepEd, as there is no clear mandate for local government units to generate, manage, and be held accountable for education delivery within their jurisdiction. This sentiment translates to how the SEF is used locally: as a stop-gap, “support”, or extra funds that LGUs provide when called upon by DepEd. One school head in the Visayas shared that whenever they need to raise funds to implement Central Office-mandated programs, they ask their barangay captain for financial support. A city administrator in Mindanao also shared that they mostly respond to requests from DepEd for funding rather than take the lead. A mayor in Metro Manila, while sharing a similar view on the role of LGUs in education delivery, however, insisted on the lead role of LGUs in the SEF programming, management, and accountability (i.e., tying funding to performance metrics).
- The complementary role that LGUs and local school boards take on may be viewed positively in the sense that it can fill the gap in an under-resourced sector. However, the Special Education Fund has historically been underutilized. Of the LGU allocated budget for SEF in 2022, only PHP 28.94 billion was utilized, or 59.45%.9 Additionally, there is also a wide disparity in the SEF revenue per capita among LGUs, ranging from Php13.35 in Sulu and Php4,121.21 in Metro Manila. The amount of complementary support that students get vary greatly depending on their locality, thereby raising equity concerns.
- Equity considerations come to the fore when evidence shows that local governments that spend SEF per capita also tend to have high scores in DTI’s Competitiveness Index (correlation of 0.39) and in UNDP’s Human Capital Development Index (HCDI) (correlation of 0.48). The correlation is even higher between SEF revenue per capita and Competitiveness Index (0.42) and HCDI (0.59).
- There are still ways to go in connecting resources with learning outcomes. The relationship between NAT scores and per capita SEF expenditure is mixed, although inferences that can be made are limited due to unavailability of census NAT data. From what is available for SY2021-2022, of the eight sampled divisions, Surigao del Norte stands out as having a per capita SEF expenditure of Php161.12 but scoring above the national average in NAT10, while Cebu Province, with similar levels of per capita SEF expenditure (Php161.51) scored below the national average.
- According to PISA data, the Philippines has low school autonomy compared to comparison countries: “In the Philippines, 32% of students attended a school where principals had the main responsibility for hiring teachers (OECD average: 60%), and 50% were enrolled in a school where teachers had the main responsibility for choosing which learning materials are used (OECD average: 76%). Many high-performing school systems tend to entrust principals and teachers with these responsibilities.”
Proposed fiscal decentralization model of Philippine basic education governance
- Fiscal decentralization is associated with good education outputs and outcomes.
- Salinas (2014), using cross-national data to examine the effects of decentralization on efficiency of educational policies in OECD countries, found that the autonomy of subnational governments matters in determining the effect of decentralization on education outcomes; specifically decision-making autonomy regarding regulation and management has a significant and positive effect on educational attainment. In Korea, Jeong, Lee, and Cho (2017) found that fiscal decentralization positively related to student outcomes using a longitudinal dataset from 1989 to 2024. In Nigeria, Akpan (2011) found that higher fiscal decentralization is consistently associated with higher literacy rate and lower infant mortality rate, especially for states with high internally generated revenue and lower population. In Spain, Salinas and Solé-Ollé (2018), using a difference-in-differences analysis in estimating the effects of partial fiscal decentralization reform in the 1980s found that the reform had a sizable impact on the percentage of students dropping out early from school. The effects are concentrated in the high-school program but not in the vocational program. Diaz-Serrano and Meix-Llop (2019) found that fiscal decentralization had a positive impact on school outcomes, using microdata from PISA test scores from 22 countries.
- Decentralization, like any reform, could have a negative impact due to weak subnational government capacity and unclear roles and responsibilities.
- Cuenca’s (2020) difference-in-difference analysis of health decentralization in the Philippines suggests that greater health decentralization has a negative impact on access to hospital in-patient services, positing that this could be due to lack of adequate health budget to maintain, and upgrade devolved health facilities. “Issues on mismatch between local government fiscal capacity and devolved functions, fragmentation of health system, existence of two track delivery system, unclear expenditure assignments among others inevitably create inefficiency.”
- One former high-ranking official of the Department of Agriculture and NEDA shared that while agriculture services were devolved to LGUs through the Local Government Code, there has been a push towards recentralization due to weak LGU capacity to implement agriculture programs.
- Some caveats on the proposed model:
- This model describes a fiscal organization that enables adequate, efficient, equitable, and quality education services.
- This is a product of literature review, interviews, and expert opinion.
- This model outlines an overall framework. Its feasibility and implementation details will need to be assessed and fleshed out.
- An audit of LGU capacity and readiness for devolution should be conducted. Those that meet the criteria can be granted more devolved functions. Division Decentralization Preparedness Criteria could include:
- Governmental awards such as DILG’s Seal of Good Local Governance, the Civil Service Commission’s Program to Institutionalize Meritocracy and Excellence in Human Resource Management (PRIME-HRM), and DTI’s Competitiveness Index, and those from civil society like Synergeia’s Seal of Good Education Governance.
- Above national median per capita SEF revenue and expenditure.
- A functioning Local School Board and a legislated Education Unit under the office of the local chief executive serving as the LSB’s secretariat should be present.
- Existing good performance and recent progress in delivering education outputs and outcomes.
- Status in other key indicators such as city/municipality classification, distance to city center, and percentage of paved road from school to city center, among others
- Regular learning assessments are necessary in making the model work.
- Guiding principles:
- One-to-one correspondence between the local government unit and education management unit. In effect, a local school board reports to both DepEd and the LGU.
- Transparency of information on budgets, expenditures, and education performance
- Devolution of as much of the regular program funds to subnational levels as possible, while retaining standards setting, monitoring, and quality assurance funds with the Central Office
- Capacity building programs are built into the model: progress is as important as performance.
- Every learner gets the same level of inputs, regardless of their location, while correcting for disparities in starting points (e.g., rural/urban, socio-economically advantaged/disadvantage).
Read more on the Pulse Asia Survey and policy notes on decentralization here: PBEd Community-Led Education Delivery